Your cameras are recording right now. But unless you know your conversion rate by the hour - and which hours are bleeding revenue - that footage isn't working for you. IDEOtics changes that, without adding a single piece of hardware.
The numbers come in at the end of the day. Traffic was up - genuinely good footfall. But the register tells a different story. You go over it in your head: was it the floor layout? A coverage gap in the afternoon? A slow zone nobody noticed?
You're not going to find the answer in the data you have. Because you don't have the right data.
Your cameras were watching the whole time. Every customer who came in and left without buying. Every hour when your busiest area went understaffed. It was all recorded - it just wasn't readable.
What IDEOtics does
IDEOtics takes the video from your existing cameras and turns it into hourly footfall counts, conversion rates, zone heatmaps, and lost revenue reports - running in the background, using the infrastructure you already paid for.
A single daily conversion rate hides more than it shows. You need to know whether it was the morning or the afternoon that underperformed - and in which part of the store.
The dashboard breaks your trading day into hourly windows. You might find that your 11am-1pm slot converts at 22%, while your 3-5pm slot - when footfall is actually higher - drops to 9%. That gap has a cause, and once you can see it, you can do something about it.
Filter by day of week, by zone, or by individual camera. The dashboard refreshes as your camera and POS data come in.
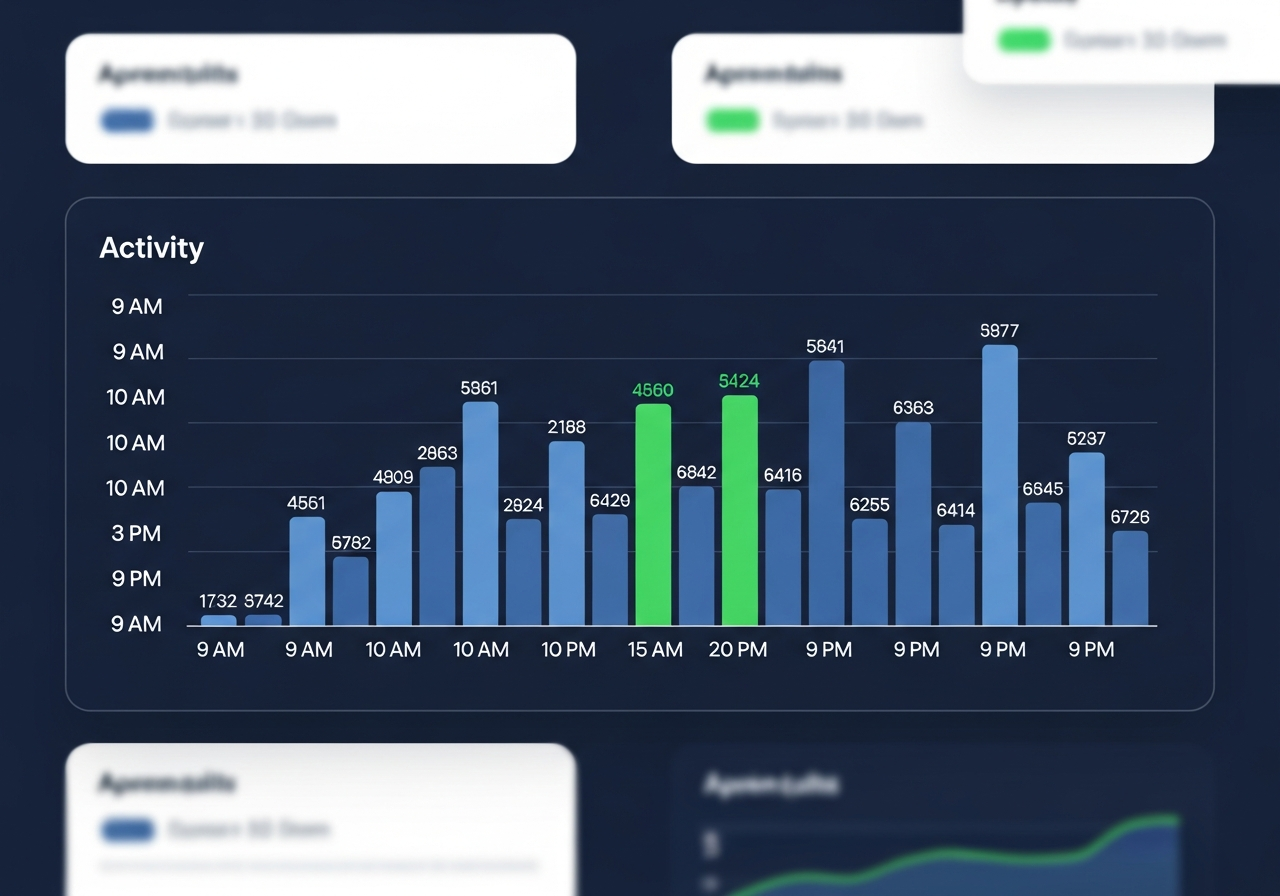
Illustrative example - your store's numbers will differ
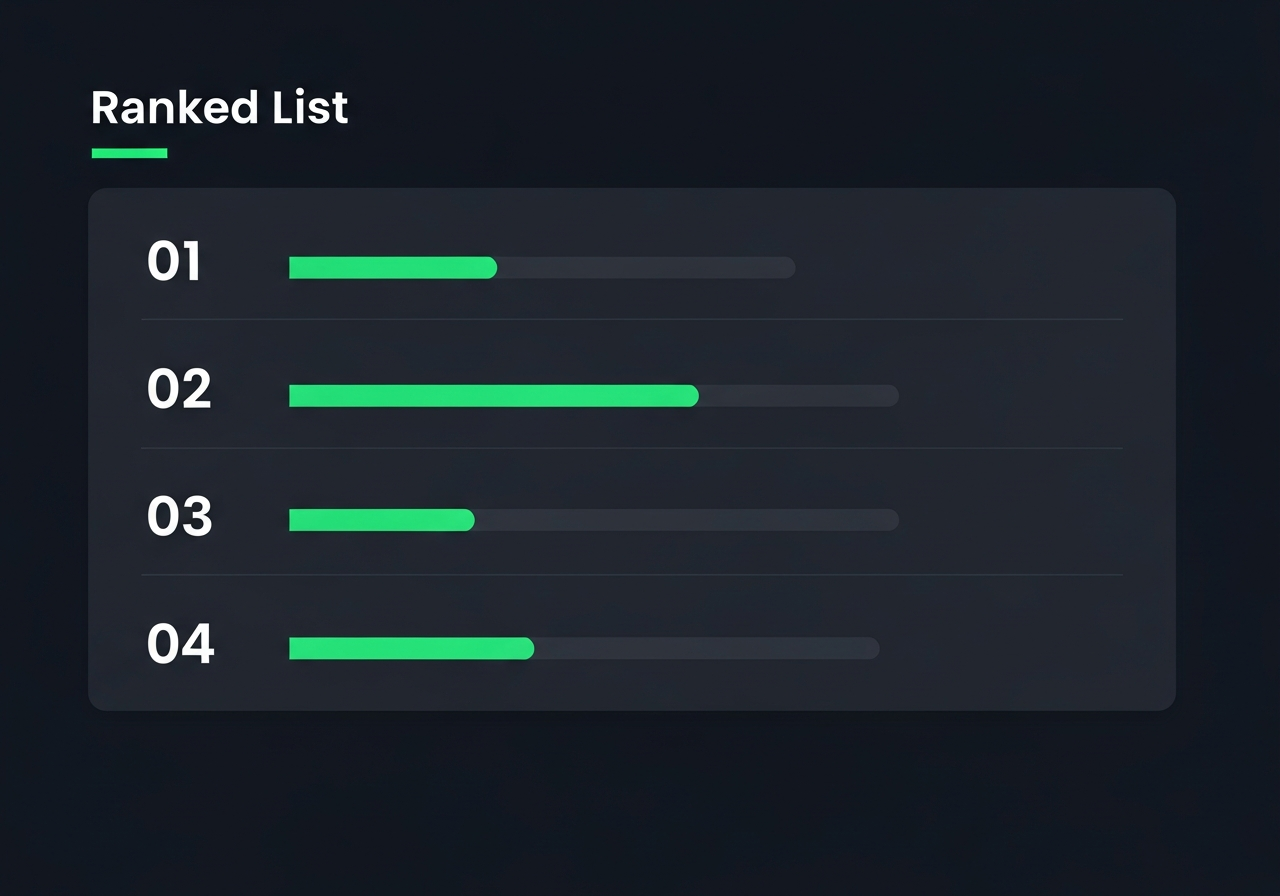
Illustrative example - ranked by revenue gap score, highest loss first
IDEOtics looks at every hour and compares footfall against transactions. When the gap is larger than your conversion rate would normally predict, it gets flagged and scored - biggest miss at the top.
Monday morning you have a ranked list. Thursday 4-5pm: 142 visitors, 6 sales. Saturday 2-3pm: 198 visitors, 11 sales. Your floor manager now has something to work with - not a hunch, a number. Was it staffing? A display that wasn't visible? A zone that needed restocking?
The question of why gets a lot easier to answer.
The heatmap shows traffic density and dwell time across your floor - where customers naturally go, which areas they walk straight past, and how long they actually stop at each point.
The results are often counterintuitive. A premium display getting a fraction of the dwell time of a nearby clearance rail. A high-traffic zone in the morning that empties by early afternoon. Knowing this changes where you put your products and your staff.
Add in the demographics - gender split, age estimates - and you can see whether the people coming into a zone are who you expected. That's useful when you're planning a promotion or deciding what goes on a display.
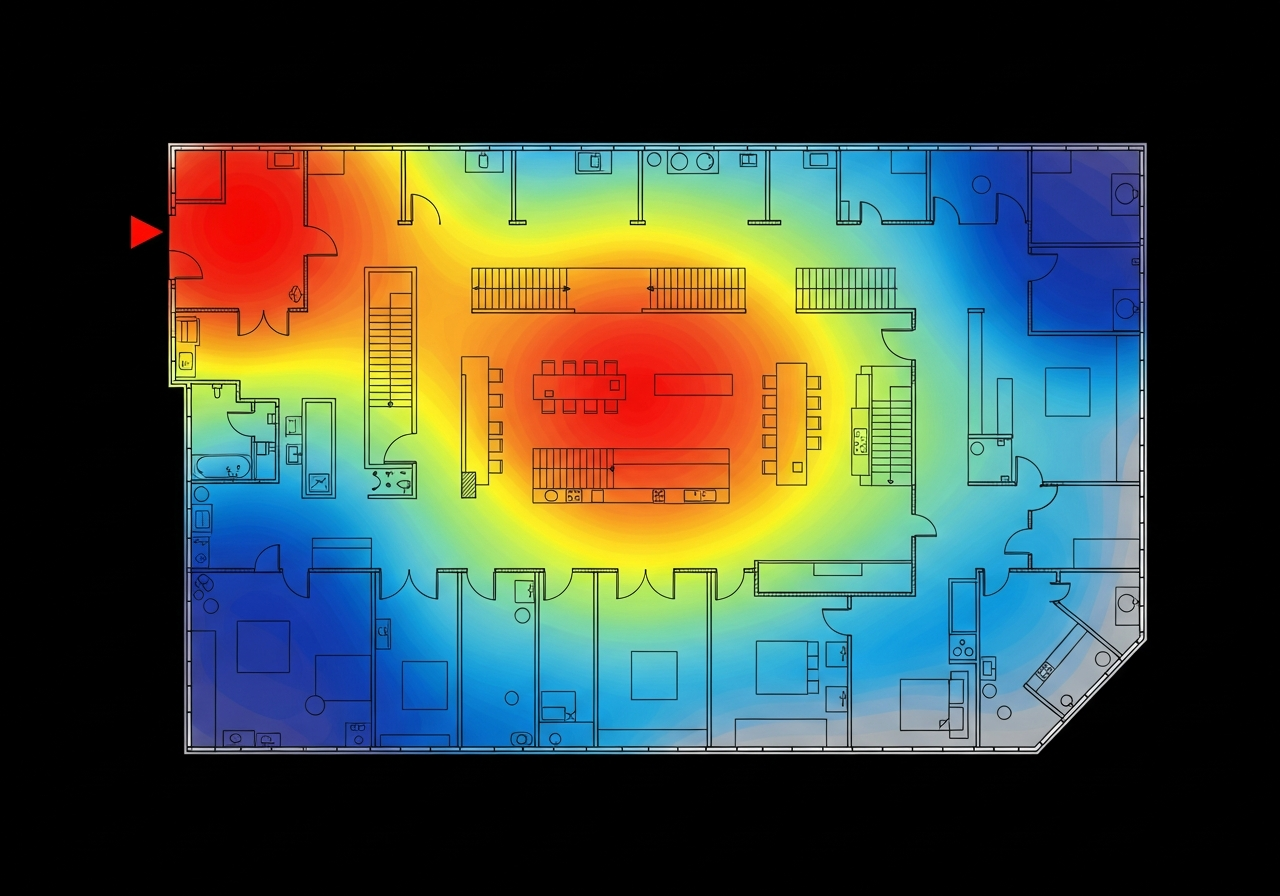
Illustrative floor plan - colours show relative footfall density from your cameras
Knowing how many people came in only tells you so much. What you actually need is the fraction that bought - and when that fraction dropped, and why. That's what you get when you connect your cameras to your POS data.
Export your POS data as CSV or Excel and upload it. Or set up the REST API connection and let IDEOtics pull it on a schedule. Either way, it matches your column names without manual configuration - date, time, amount, transaction ID. Your conversion rate is then calculated from real numbers, not an average.
No integration project. No developer required.
Start your free pilotNo IT project. No hardware order. Most retailers have a working dashboard within a week.
You connect your existing camera feeds to the IDEOtics platform. The setup guide walks you through it. If your cameras are already running and accessible on your network, Day 1 is usually under an hour.
Drop in a CSV or Excel export from your POS system, or point IDEOtics at your API endpoint. It figures out your column structure on its own. Duplicate records get skipped so your historical data comes in clean.
Your conversion rate dashboard appears - hourly breakdown, by zone, with demographic split. Most people go straight to the hour with the highest footfall and check whether the transactions were there.
The Lost Opportunity report arrives - ranked by revenue gap. You can now sit down with your floor manager and point to specific hours and zones. It's a different kind of conversation when there's a number in front of you instead of a feeling.
IDEOtics is built by SigMax-e, a Malaysian technology company working with hi-tech clients since 2002. We were doing computer vision and video analytics work for years before we applied it to retail.
Physical retailers have been competing against e-commerce for two decades without the same quality of data. An online retailer knows every click, every pause, every abandoned cart. A store owner has cameras on the ceiling and a daily transaction total. We thought that was a solvable problem.
Our team covers computer vision, data science, and software engineering. When we built the platform, we made a decision early on: it had to work on cameras retailers already owned. Adding hardware cost to an analytics product kills adoption, and we didn't want that to be the reason someone didn't try it.
IDEOtics counts the number of people who enter your store using your existing CCTV cameras - this is your footfall count. It then takes your POS transaction count for the same period and divides: transactions ÷ footfall = conversion rate. This updates automatically hour by hour as your camera and POS data flow in.
No. IDEOtics works with any existing IP CCTV camera - no additional hardware required. We built it that way deliberately. Requiring new equipment is the fastest way to kill adoption, so we made a point of not doing it.
A Lost Opportunity report identifies the exact hours or zones where footfall was high but revenue was low. IDEOtics calculates a gap score for each time window - the difference between the transactions you might have expected at your average conversion rate and the transactions that actually happened. It then ranks those gaps from largest to smallest, giving you a prioritised list of where your store is losing money and when.
IDEOtics supports two methods. First, file-based import: you upload a CSV, XLS, or XLSX export from your POS system and IDEOtics detects your column names automatically via synonym matching. Second, a REST API connector: you configure your POS endpoint URL and authentication credentials, and IDEOtics pulls transactions on a schedule. Duplicate transaction IDs per project are detected and skipped automatically.
An in-store heatmap is a colour-coded overlay that shows which zones in your store attract the most foot traffic and how long customers spend there. You define zones by assigning your existing cameras to named areas - Entrance, Checkout, Aisle 3 - using a drag-and-drop interface. IDEOtics then processes the footage and generates a density map so you can immediately see your hotspots and cold spots.
IDEOtics captures footfall counts, dwell time per zone, gender distribution, and age-group estimates - all from your existing CCTV footage. No personally identifiable information is stored. The data is aggregated into demographic breakdowns (for example: 58% female, 42% aged 25-44) so you can align your product range, promotions, and staffing with who is actually shopping in your store.
Most retailers see their first conversion rate dashboard within a week of signing up. Day 1 is camera connection. Days 2 to 3 are POS data setup. Days 4 to 7 your first dashboard appears. Week 2 onwards you receive your first Lost Opportunity report. There is no hardware procurement, no installation team, and no lengthy IT project involved.
Connect your cameras and POS data and you'll have a working conversion dashboard within a week. Free pilot - no hardware to buy, no long-term commitment.
Start your free pilot today